The 2026 World Cup Tracker is a purpose-built web app for following the tournament as it unfolds. It brings together live match data, group standings, match cards, team profiles, scorer rankings, knockout projections, and third-place qualification logic into a single lightweight dashboard.
Problem
Following the World Cup often requires too much assembly. The information exists, but it is scattered across schedules, standings pages, match reports, brackets, news coverage, and broadcast graphics. I wanted something that answered the questions I kept asking as a fan: who is leading the group, who still has a path through, which third-place teams are in position to advance, what happens if the current results hold, and what does the knockout bracket look like right now?
The product goal was not to replace full sports coverage. It was to reduce friction. The tracker is designed to make the tournament easier to read in the moment, especially as results start changing the shape of the bracket.
Solution
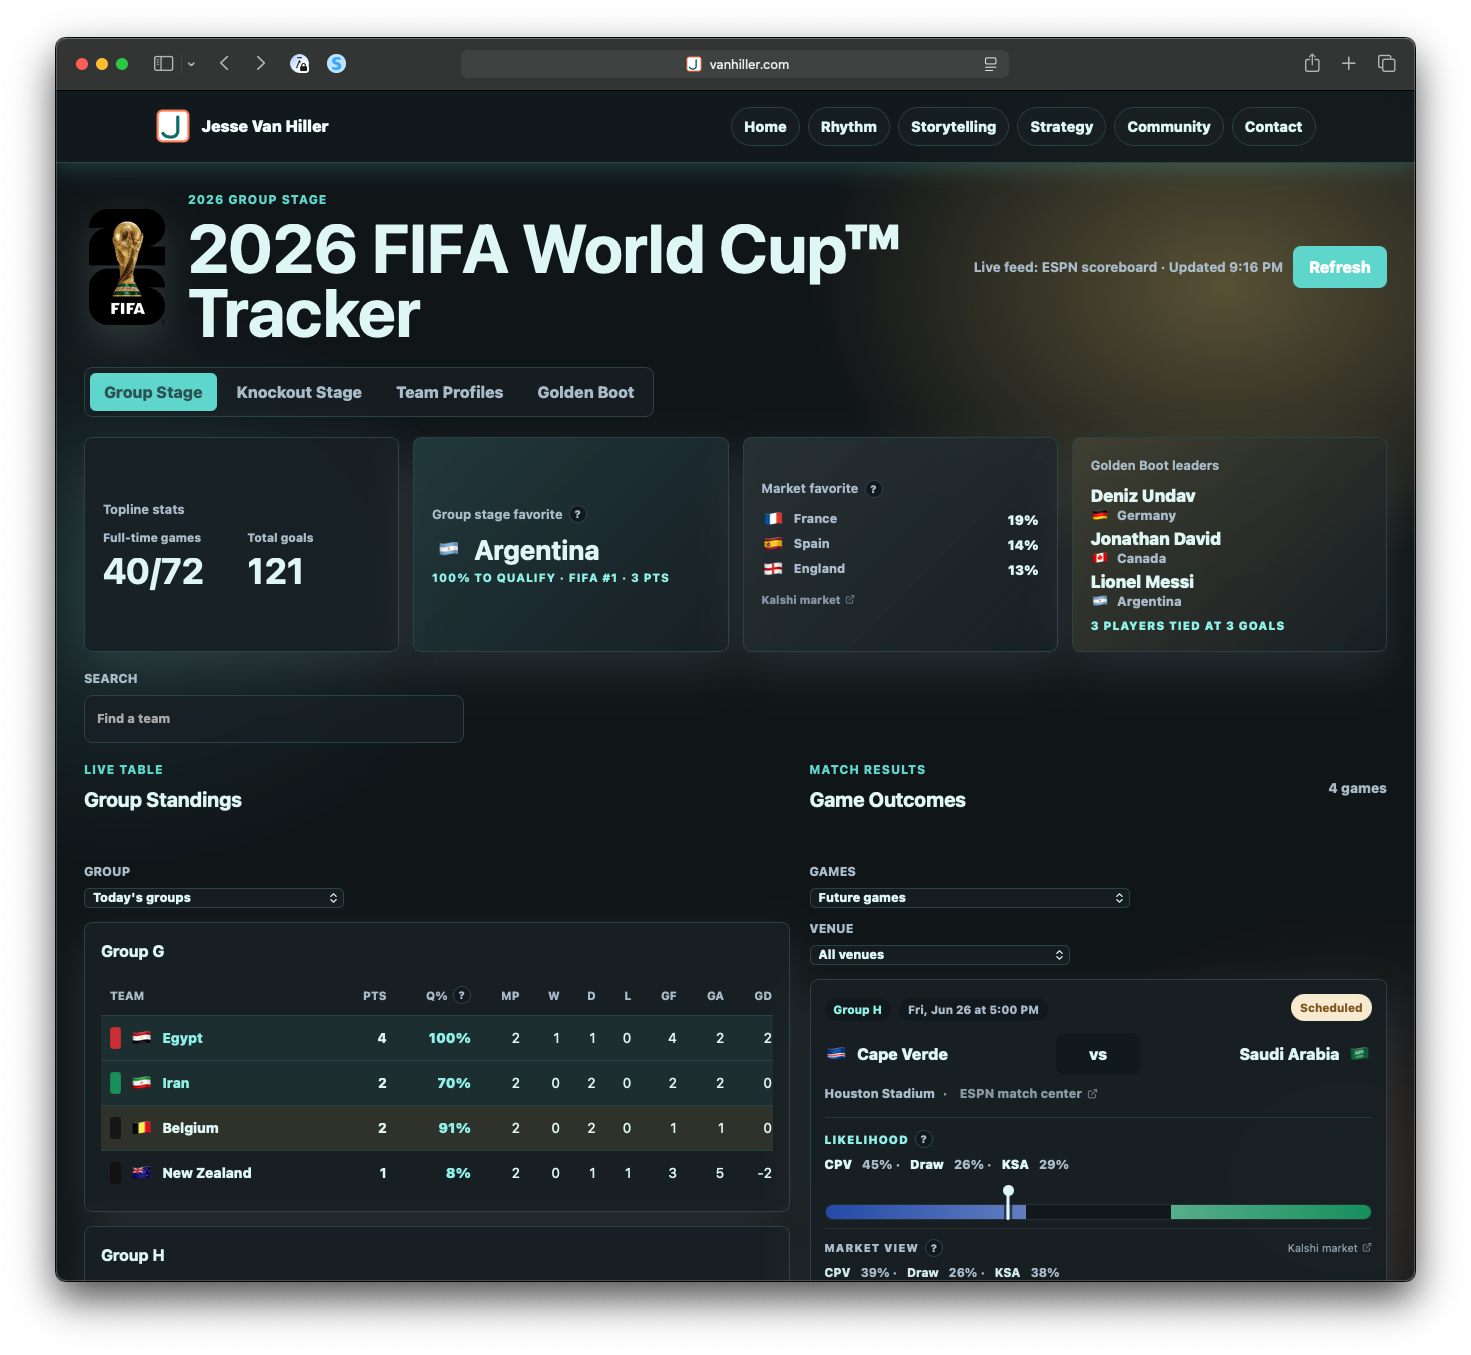
The app includes group standings, live and completed match cards, team-level views, Golden Boot tracking, projected knockout paths, third-place candidate rankings, stadium and round filters, ESPN match links, and comparison context from prediction markets. It also includes explanatory tooltips and responsive layouts so the experience works as a quick reference on desktop or mobile.
The core product challenge was coherence. Each visible feature depends on the same underlying tournament model behaving correctly across groups, teams, matches, standings, scorers, third-place rules, and projected knockout placements. A small issue in group mapping, match identity, or fallback data can ripple through the app. Much of the work involved validating the system as a whole rather than treating each feature as a separate module.
I designed and built the tracker with Codex through a series of iterative product, design, data, and QA passes. The project moved from a basic live score and standings tracker into a complete tournament dashboard with projections, market comparison, mobile polish, and public-site readiness. Codex estimated the work at roughly 35–55 hours of focused senior frontend/product engineering effort, compressed through AI-assisted implementation and repeated product review.
Project Timeline and Effort Summary
The 2026 World Cup Tracker evolved over roughly nine days from a standalone live score tracker into a complete tournament dashboard with projections, market comparison, and mobile-ready presentation.
Development Timeline
Day 1
The project began with the standalone tracker foundation. This included the 2026 group structure, live and current scores, standings, game cards, flags, search and sort behavior, a playoff bracket, Round of 32 projections, third-place candidate ranking, knockout matchups, team profiles, and internal linking between teams and groups. The early work combined feature development, data modeling, visual/UI decisions, debugging, and environment setup.
Day 2
The next phase added Golden Boot tracking from ESPN match summaries. This included scorer cards, a full scorer table, own-goal exclusion, assists and penalties context, links into team profiles, and cleanup needed to make the tracker feel ready for public viewing. The focus expanded from match and team structure into player-level data and presentation.
Day 3
The tracker moved into public-site testing and deployment validation. During that process, a Group G/H data issue surfaced and was corrected. That fix required checking downstream effects across standings, fallback labels, team profiles, matches, and bracket projections. This phase reinforced how dependent the app was on the accuracy of the shared tournament data layer.
Day 4
The group-stage experience became more refined. Tabs were renamed, today/future/past filters were added, qualification percentages were introduced, and tooltip explanations helped make the logic easier to understand. Game likelihood gauges, scoring and conduct information, and top dashboard cards gave the app more interpretive value instead of simply displaying raw match data.
Day 5–6
The knockout architecture was reworked more substantially. This included projected games, third-place rankings, bracket views, knockout likelihoods, round and location filters, FIFA stadium-name mapping, ESPN match links, and clearer visual language for off-site links. The tracker moved further from a schedule and standings tool toward a broader tournament navigation experience.
Day 7
A market comparison layer was added for upcoming matches, including Kalshi-style market context, explanatory tooltips, and responsible-wagering language. This also required working through static build and deploy behavior for generated market data. The project gained another layer of comparison, but also another set of data modeling and deployment considerations.
Day 8
The projection dashboard was polished and consolidated. Top stats were combined, market favorite context was added, Golden Boot leaders were refined, and the visual bracket was rebuilt with projected winners and focused round views. This phase also included cleanup around GitHub and IONOS workflow issues, making the public publishing process more stable.
Day 9
The final phase focused on explanation, polish, and usability. Projection methodology copy was added, legends were moved, first-load bracket connector rendering was fixed, spacing was refined, and nested scrolling issues were corrected. The work also shifted into retrospective documentation, including the timeline, effort summary, and overall project framing.
Effort by Category
Feature development
The largest share of the work went into feature development, roughly 38–42% of the total effort. This covered the core product experience: standings, score cards, tabs, team profiles, Golden Boot tracking, bracket views, projected game cards, filters, and dashboard cards. These were the visible features that turned the tracker from a basic scoreboard into a tournament dashboard.
Visual and UI refinement
Visual and UI refinement represented roughly 23–27% of the effort. This included bracket layout, leader lines, card sizing, responsive and mobile behavior, flags, top-card styling, tooltips, and overall page flow. Much of this work was about making the tracker readable and usable, especially as the amount of information on the page increased.
Data sourcing and modeling
Data sourcing and modeling accounted for roughly 15–18% of the work. This included ESPN scoreboard and summary feeds, group mappings, fallback schedules, FIFA metadata, third-place rules, projection inputs, and Kalshi-style market data. This was the structural layer underneath the app, and it carried much of the project risk.
Debugging and QA
Debugging and QA represented roughly 10–12% of the effort. This included layout regressions, connector rendering, mobile scroll bugs, deployed-site validation, syntax and diff checks, and data correctness checks. The most important QA work involved making sure changes in one part of the tracker did not quietly break another part of the experience.
Public-site readiness and deployment
Public-site readiness and deployment accounted for roughly 5–7% of the effort. This included static build behavior, deploy-safe paths, generated assets, GitHub and IONOS cleanup, and the local-to-public publish flow. This work made the difference between a local prototype and something that could be reliably shared.
Environment and workflow
Environment and workflow represented roughly 3–4% of the effort. This included ports, local previews, Directus and site context, build routines, and process cleanup. These tasks were less visible to the user, but they supported the ability to keep building, previewing, and deploying the tracker.
Documentation and retrospective
Documentation and retrospective work represented roughly 2% of the total effort. This included the timeline, category summary, effort estimation, and project framing. This final layer helped turn the tracker from a one-off build into a portfolio-ready product work artifact.
Project Arc
The overall arc of the project was: live score tracker → complete tournament dashboard → projection and market comparison experience → polished mobile-ready microsite.
The highest-risk work was the shared data layer. Once group mappings, standings, third-place logic, or match identity are off, everything downstream gets weird fast. Standings, team profiles, match cards, projections, bracket placement, and dashboard summaries all depend on the same underlying structure behaving correctly.
Features
Tournament snapshot
- Total games and goals, group stage favorite, prediction market favorites, golden boot leaders
- Group standings and qualifying percentage
- Team search and filters by group and active today
- Home and away teams, scoring, conduct, outcome prediction and prediction market standings, location
- Filtering by time and location

Knockout
- Game schedule and outcomes
- Projected winners for group stage and individual matches
- Market comparison to outcome probability
- Third-place modeling based on FIFA placement rules (ranking, conduct, etc...)


Team Profile
- Simple team profile with top line stats, group standings summary, historical performance

Golden Boot tracker
- List top three with assists, last goal, and penalties

Resources
- API (ESPN, Kalshi markets)
- Dynamic page and js calculation engine
- Codex, Astro, GitHub
- Coffee, Mac, and iPhone